7 Chrome Tips Developers & Designers May Not Know
August 2, 2011
](http://1.bp.blogspot.com/-wX_MlsWktmI/TjDlzHyAELI/AAAAAAAAJ6o/kT51-4FQMSU/s1600/chrome-firefox1.png)
I'm not sure about you, but Google Chrome has been my primary browser for quite some time. At first the simplicity and speed of Chrome initially drew me in. I do admit I went back to Firefox every so often for Firebug's rich set of debugging tools.
However, over the past year or so the amount of tooling for developers and designers in Chrome has grown immensely.
Here are some fairly recent features of Google Chrome that you may not be aware of...
1. The ability to modify the source JavaScript and execute it
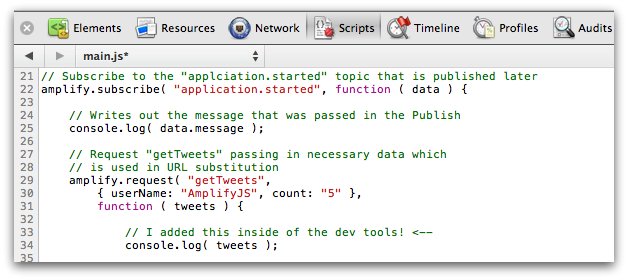
How many times have you been tinkering around JavaScript and wished you could tweak it out temporarily just to test something out? Well, if you are using IE or Firefox then you are out of luck, however in Chrome you can just double-click inside a JavaScript file, make changes, and then proceed to run the web application like normal ( see line 33 ).
](http://4.bp.blogspot.com/-BYqkDXr0qTk/TjeJvZHo_uI/AAAAAAAAJ7w/lgIQJmI2m1o/s1600/UpdateScript1.png)
Usages for this could be as simple as adding a console.log or modifying a piece of code that you think is broken. Of course, you should note that if you refresh the page you will lose all of your changes, so this technique is only meant as a quick and temporary debugging solution.
2. The ability to Pretty Print ( a.k.a. unminify ) JavaScript source
Sometimes I'm trying to figure out a bug and unfortunately the JavaScript that was included has been minified. As you are aware trying to debug a minified file is nearly impossible. How do you set a break point on a line that is a bazillion characters long?
](http://4.bp.blogspot.com/-6n6vf-SMdgg/TjeNPkFTutI/AAAAAAAAJ8Y/sQ12cSIt9_4/s1600/Unminified3.png)
Thankfully Chrome has a Pretty Print feature that will take a minified JavaScript file and format it property. All you need to do is to click the "{ }" icon on the bottom toolbar to activate this feature. Of course the names will still be obfuscated ( depending on what program minfied the JavaScript in the first place ), but you will at least be able to set break points and debug the code.
3. The ability to break in JavaScript when an element has changed in the DOM
Let's say that you are tasked with finding the code that manipulates a particular DOM element. It can become quite difficult to track down code for a certain behavior especially if your codebase has grown quite large or if you are diving into a slightly unfamiliar project.
Chrome thankfully saves the day again by providing the following unique features
- Break on subtree modifications
- Break on attributes modifications
- Break on node removal
](http://1.bp.blogspot.com/-IEL7Q5UKAuc/TjeN_YbVOuI/AAAAAAAAJ8k/1VaYxylBUhc/s1600/BreakOfSubTree.png)
This way you can find the DOM element in question and then right-click on it to select one of the above options. Then, when one of the above criteria happens a break point will occur where the JavaScript is performing that action. Brilliant!
](http://3.bp.blogspot.com/-eWtu4qme32k/TjeSkofwGbI/AAAAAAAAJ80/H08LSFZ74MY/s1600/BreakPointOnChange2.png)
Note: The breakpoint you end up on might be way down in the heart of a minified library (such as jQuery), but fortunately you can use the call stack on the right to find your way back up to where your code lies.
4. The ability to change a CSS stylesheet file as if it were an editor
You are probably familiar with changing the styles on the Elements tab either by manipulating the HTML or by changing values individually on the right in the matched CSS rules section. This concept is very similar to your experiences in Firefox up till today.
](http://2.bp.blogspot.com/-gC2SccbiQRo/TjeZizVWjsI/AAAAAAAAJ9A/Tkdo0GrZpQA/s1600/editcss.png)
Instead of modifying the CSS like above you can switch to the Resources tab and find the CSS file you are interested in, double click inside of it, and make changes to your heart's content ( see line 11 ). A quicker way I do this is by clicking the file & line number link in the Matched CSS Rules pane which jumps me directly to the correct location in the Resources tab where I can start modifying rules.
5. The ability to inspect CSS pseudo-class selectors
Trying to find the pseudo-class rule that matches an element has been considerably painful. How can you hover over an element and at the same time be interacting with the developer tools?
Well, you can now with the Google Chrome. You can access it from the styles pane by clicking the little arrow inside a dashed box ( see the following image ). Then you just check the pseudo-classes that you want to examine.
](http://2.bp.blogspot.com/-zC_1v0Ijn3I/TjebiPOEHcI/AAAAAAAAJ9Q/BQoOmfAo6U8/s1600/csspsudeo2.png)
Note: This is one of the newer features in Google Chrome and as a result you will need either the dev branch or the canary build for this to work.
6. The ability to access most features via keyboard shortcuts
I love myself some keyboard shortcuts! I've recently picked up MacVim and the Vico App and have really been enjoying it. The great news is that the Chrome Dev Tools also have keyboard shortcuts. When you are in the Elements tab type "?" and the following screen will pop up with a whole bunch of useful keyboard shortcuts.
](http://2.bp.blogspot.com/-6WcUJkCsg1c/TjecvtqghKI/AAAAAAAAJ9c/MI_uGVK0Kis/s1600/keyboardshortcuts.png)
7. The ability to configure settings your way
The Dev Tools have a set of options that you may not be aware of. The two options that I find most useful are "Log XMLHttpRequests" ( a feature I missed from Firebug for a long time ) and "Preserve log upon navigation".
](http://1.bp.blogspot.com/-swwBXHP7JWo/TjedFItAPsI/AAAAAAAAJ9o/CpN3PcrfDQk/s1600/settings.png)
& Many, many, more...
Chrome has been adding a lot of great new features recently. Paul Irish has put together several screencasts and videos describing some of these new features. I've highlighted some of these above, but there are many others.
- Google Chrome Developer Tools: 12 Tricks to Develop Quicker
- A Re-introduction to the Chrome Developer Tools
- Quick color manipulation with the Chrome DevTools & more
- Google I/O 2011: Chrome Dev Tools Reloaded
There is also a cheatsheet you might be interested in created by Boris Smus.
Tweet about this post and have it show up here!